To justify context to stack mapping I should really show you the costs of using contexts instead of just waiving my hands and referencing the Green Book (thanks Glenn, Stephane and Addison Wesley!!). That means profiling a VM. Unless you’re a prescient genius you don’t have a hope of producing a faster VM unless you can accurately profile the one you have and figure out what has to change. OK, yes, to an extent we can all now be prescient geniuses because fast Smalltalk and Java VMs have already been built and one can read the papers about them. But it still helps convince one’s employer, for example, when one can point and say "Look, there, I told you so. Contexts are slow!"
Over the years I’ve implemented three VM profilers. When implementing BrouHaHa I started off building a graphical front-end to the profil system call which was how one did profiling in the 70’s. Here’s the profil system call. Amazingly enough it still exsts on my Mac OS X laptop:
NAME
     profil -- control process profiling

SYNOPSIS
     int
     profil(char *samples, size_t size, u_long offset, u_int scale);

DESCRIPTION
     The profil() function enables or disables program counter profiling of
     the current process.  If profiling is enabled, then at every clock tick,
     the kernel updates an appropriate count in the samples buffer.

     The buffer samples contains size bytes and is divided into a series of
     16-bit bins.  Each bin counts the number of times the program counter was
     in a particular address range in the process when a clock tick occurred
     while profiling was enabled.  For a given program counter address, the
     number of the corresponding bin is given by the relation:

           [(pc - offset) / 2] * scale / 65536

     The offset parameter is the lowest address at which the kernel takes pro-
     gram counter samples.  The scale parameter ranges from 1 to 65536 and can
     be used to change the span of the bins.  A scale of 65536 maps each bin
     to 2 bytes of address range; a scale of 32768 gives 4 bytes, 16384 gives
     8 bytes and so on.  Intermediate values provide approximate intermediate
     ranges.  A scale value of 0 disables profiling.

RETURN VALUES
     If the scale value is nonzero and the buffer samples contains an illegal
     address, profil() returns -1, profiling is terminated and errno is set
     appropriately.  Otherwise profil() returns 0.
The C library provides a wrapper around this called moncontrol(3) which will take care of allocating the right size buffer and dumping it to a binary file called gmon.out.
Delightfully simple, it is really nice when one displays the histogram as a graph; then ape-descendents such as myself can actually spot the expensive parts of the program because they’re where the line goes to the top of the page; something I find much easier than reading tables of numbers. For something as simple as a Smalltalk virtual machine a call graph profiler really doesn’t tell you much you don’t already know. The VM is essentally flat and doesn’t contain many really interesting algorithms. It is simply an engine and what you need to know are what regions are creating internal friction.
The Idée Fixe
When I went to work for ParcPlace on April 1st of 1995, which in August became ParcPlace-Digitalk, and which all too soon thereafter became DarkPlace-Dodgytalk, etc, etc, I needed a profiler to make sense of the magnificent new beast I was to work on for the next decade, the ParcPlace virtual machine HPS by Peter Deutsch, Allan Schiffman, David Ungar and Frank Jackson. I had this fixed idea that the way one did profiling was one maintained a histogram in memory, sampling the pc periodically and updating the corresponding bin in the histogram. Beause I wanted to profile on Windows as well as Unix I reimplemented the profil scheme using my own interrupt handlers. In Windows one way to get at the pc is as follows:
#include <windows.h>

            CONTEXT VMContext;
            unsigned long pc;
            VMContext.ContextFlags = CONTEXT_CONTROL | THREAD_GET_CONTEXT;
            GetThreadContext(VMThread, &VMContext);
            pc = VMContext.Eip;
You can wrap this up in a little state machine thread that ticks along using a wait on an OS semaphore that will time out every so many milliseconds:
/*
 * This is the profiling loop.  It spins waiting for a short delay and then
 * sampling the pc of the main thread.  We can assume that GetThreadContext
 * will work if the profile thread is a higher priority than the profiled
 * thread and they are running on the same processor.  We use (thanks Andreas!)
 * SetThreadAffinityMask to force the two threads to share a processor. Other-
 * -wise we would have to use SuspendThread/resumeThread on machines with more
 * than one hyper-thread/core/processor.  (See initProfile & ioControlProfile)
 */
static DWORD WINAPI
profileStateMachine(void *ignored)
{
    profileState = quiescent;
    while (profileState != dead) {
        DWORD res = WaitForSingleObject(profileSemaphore,
                                        profileState == active
                                            ? profileMilliseconds
                                            : INFINITE);
        if (res == WAIT_TIMEOUT
         && profileState == active) {
            CONTEXT VMContext;
            unsigned long pc;
            VMContext.ContextFlags = CONTEXT_CONTROL | THREAD_GET_CONTEXT;
            GetThreadContext(VMThread, &VMContext);
            pc = VMContext.Eip;
            if (pc >= first_vm_pc && pc < limit_vm_pc)
                ++vm_bins[pc - first_vm_pc];
            else
                ++eas_bins[pc >> EAS_SCALE];
        }
        else if ((long)res < 0)
            abortMessage(TEXT("WaitForSingleObject(profileSemaphore... error %ld"), GetLastError());
    }
    return 0;
}
All very well. Using ones own machinery the histogram bins can be 32-bits in size, relieving one of the anxiety that, at 64k samples per bin, a tight loop might overflow a bin or two. Wrap this kind of machinery up in a few primitives and you write an interactive VM profiler in Smalltak that will allow you to profile interactively.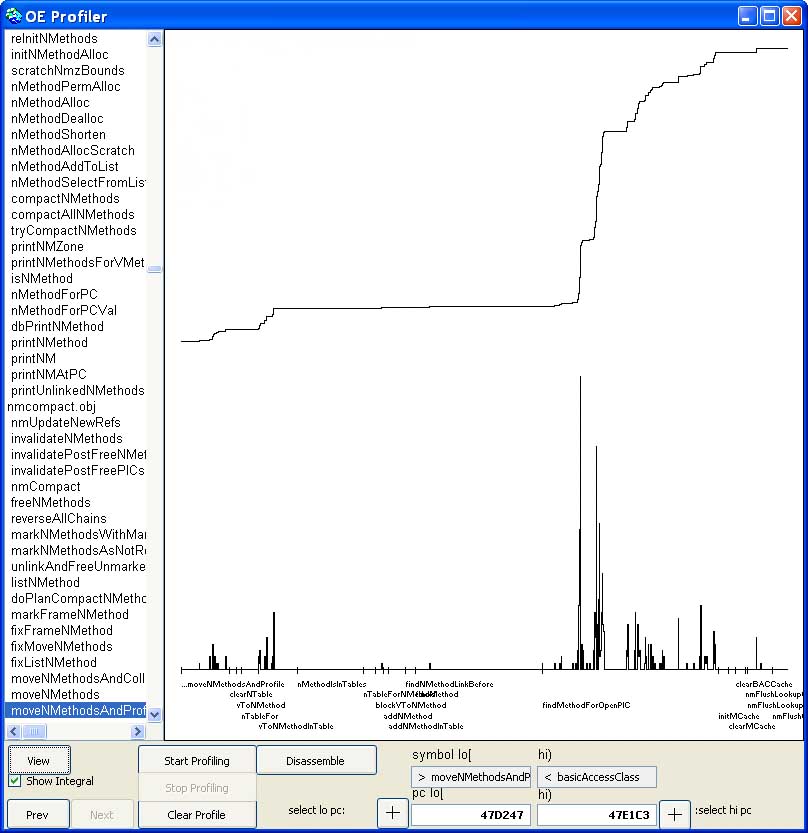
Adding some support for getting the addresses of native code the VM generates one can also profile the running system, not just the VM itself. Because a VM like HPS actually relocates and discards generated code you can move the profile data to match and hence profile the VM over long periods of time even when it is moving native code around. Neat.
My VisualWorks/HPS profiler had one histogram for the VM and a separate histogram for the generated code. HPS generates native code to a fixed size region it allocates at startup. I alloated a few bins in the profile to hold samples tat fell outside of these two histograms so I could know if time was being spent elsewhere even if I didnt know where. This was fine for optimizing the virtual machine and its generated code, and that was my obsession, so all was well and good.
The Fatal Flaw
When I started on the Cog VM at Qwaq I made the mistake of plowing ahead, assuming I knew how to make a faster VM, and starting on a VM that mapped contexts to a more-or-less conventional stack organization, a la HPS (more, much more, in a subsequent post). When this VM didn't perform as well as expected I had to do what I should have done in the first place and implemented my third VM profiler. But the Qwaq VM is just a small part of a large substrate of C-level libraries which support the Qwaq Forums 3D virtual world. There is the Open GL library and sound libraries and a number of external plugins and on Mac OS X nearly 90 other libraries in the entire application substrate. Above the VM lives the Smalltalk code that is the brain of the application but the body beneath has a complex metabolism that it is my job to get into better shape.
The trouble is that a histogram approach doesn't scale well to a 32-bit address space. It is fine for programs with a few mnegabytes of code but when you look at the address psace on Mac OS X you'll find libraries throguhout the address space, cdoe being compiled on the fly by Open GL and the OS (for interrupt handling) and placed in the middle of the C heap or high up on the C stack. You really need to be able to sample the pc anywhere in the entire address space. The hack I came up with, still not able to leave the histogram behind, was to use two histograms, one with high resolution, e.g. one bin per byte, for the VM itself, and another histogram for the entire address space, mapping 8k of addresses to a single bin. (2 raisedTo: 32) / (8192) * 4 = 2097152. So three megabytes or so of memory will profile the VM and give one 8k reslution throuhout the rest of the address space. Hence the code above:
            if (pc >= first_vm_pc && pc < limit_vm_pc)
                ++vm_bins[pc - first_vm_pc];
            else
                ++eas_bins[pc >> EAS_SCALE];
The problem is that this is crap. 8k resolution is not up to much. You can't tell whether the huge spike in the middle of the C library accounting for 13% of entire execution time is a call on select or a call on strcpy. Hmph.
Luckily finer minds than mine have evolved significantly further from their ape ancestors than I have and have figured out that a histogram at the lowest level is an idea that has run its course. If you look at dtrace and Shark these tools are based on a buffer into which are written pc samples. Instead fo the low level machinery maintaining the histogram it merely saves the samples. The size of the buffer and the sampling frequency determine for how long one can profile. Organize the buffer as a ring and one can record the samples for the immediate past, simply overwriting old samples if the buffer is smaller than needed for the profiled period.
With the sample buffer approach the low level machinery is simpler, for example, one doesn't need to determine the start and end address of the VM, and the resolution is perfect throughout the address space. If one does a little arithmetic (something me and my friends in Gombe find harder than we should) one finds that the memory requirements are quite reasonable. Five minutes of 32-bit samples at, say 1 KHz, is 4 * 5 * 60 * 1024 = 1228800 bytes, which is a lot more economical than the histgram approach. The sample buffer is a pay-as-you-go approach. A profiling blue pill. Provide a bigger buffer and profile for longer. The histogram approach is simply stiff. Stiff as in "late Dent, Arthur Dent".
The Perfected Profiler
Of course no profiler, no software, is perfect. Arguably one of the hallmarks of software is its infinite perfectibility; Microsoft software being transfinitely perfectible. Long may it remain so as I've still to save for my retirement. [Do you think your employer won't catch on that you're permanently postponing putting out the perfect product? ed.] But this one's a substantial improvement on its predecessors.
At the bottom is machinery that samples the pc, but does so out of sync with the rest of the VM. Andreas has been bitten by profilers before in that if one drives the profiler off the same heart beat as the system uses for things like delays one may not profile accurately and end up sampling the pc whenever the VM is responding to the latest timer interrupt. So the profiler has its own clock:
typedef enum { dead, nascent, quiescent, active } machine_state;
machine_state profileState = dead,
              nextState = dead;

#define PROFILE_USECS 666 /* chosen to be out of phase with the delay resolution of 1000 */
static volatile struct timespec proftime = { 0, PROFILE_USECS * 1000};

static void *
profileStateMachine(void *ignored)
{
    profileState = quiescent;
    while (profileState != dead) {
        struct timespec naptime;
        naptime = proftime;
        while (nanosleep(&naptime, &naptime) == -1) /* repeat */;
        if (profileState == active)
            pthread_kill(mainThread, SIGPROF);
        profileState = nextState;
    }
    return 0;
}
If you try and use Unix's interval timers you'll be sorely disappointed. The ITIMER_PROF timer, as all three available via setitimer(2) do, has only 20ms minimum period, or 50Hz. But the signal handler for the SIGPROF signal is a reliable if annoyingly platform-dependent way to get at the pc:
#include <ucontext.h>

/*
 * Example of 2meg buffer (512k samples) gives nearly 6 minutes of profile.
 *
 * 2 * 1024 * 1024  = 512 * 1024 pcs (each pc 4 bytes)
 * Sampling frequency is 1000000 usecs / 666 usecs = 1501 Hz (1501 pcs / sec)
 * 512 * 1024 / 1501 = 349 seconds = 5.8 minutes
 */

static unsigned long *pc_buffer;
static long pc_buffer_index;
static long pc_buffer_size;
static long pc_buffer_wrapped;

static void
pcbufferSIGPROFhandler(int sig, siginfo_t *info, ucontext_t *uap)
{
#if __APPLE__ && __MACH__ && __i386__
    pctype pc = uap->uc_mcontext->ss.eip;
#elif __APPLE__ && __MACH__ && __ppc__
    pctype pc = uap->uc_mcontext->ss.srr0;
#elif __linux__ && __i386__
    pctype pc = uap->uc_mcontext.gregs[REG_EIP];
#else
# error need to implement extracting pc from a ucontext_t on this system
#endif
    pc_buffer[pc_buffer_index] = pc;
    if (++pc_buffer_index >= pc_buffer_size) {
        pc_buffer_index = 0;
        pc_buffer_wrapped = 1;
    }
}
Now all one needs is a way to convert the samples into a histogram that pans the entire address space, and a way to label the graph. Sparse arrays solve the first problem. There's even a serviceable one in Squeak, SparseLargeTable, from which one can derive a SparseLargeArray that is most acceptable:
QVMProfiler methods for initialization
initialize
"Use a SparseLargeArray so we can apparently have a sample per pc in the entire address space"
highResSamples := SparseLargeArray
new: (2 raisedToInteger: 32)
chunkSize: 32 * 1024
arrayClass: Array
base: 0
defaultValue: 0.
lowResolution := 16 * 1024.
lowResSamples := Array new: (2 raisedToInteger: 32) / lowResolution.
self initializeSymbols.
self clearHistory.
symbolsMode := #byAddress.
symbolTypes := IdentitySet new.
selections := ByteArray new.
highAddress := lowAddress := minSelectionIndex := maxSelectionIndex := 0.
self toggleShowing: #module.
aboutToProfile := false.
total := rangeTotal := startTime := elapsedTime := 0.
gcPriorToProfile := clearPriorToProfile := true.
forkProfile := false
QVMProfiler methods for profiling
computeHistograms: numSamples
sampleBuffer isNil ifTrue:
[sampleBuffer := Bitmap new: self profileSize].
self getVMProfileSamplesInto: sampleBuffer.
Cursor wait showWhile:
[1 to: numSamples do:
[:i| | pc |
pc := sampleBuffer at: i.
highResSamples noCheckAt: pc put: (highResSamples noCheckAt: pc) + 1.
lowResSamples at: pc // lowResolution + 1 put: (lowResSamples at: pc // lowResolution + 1) + 1]].
total := total + numSamples
We use the low resolution histogram when the graph has a low resolution and is showing large regions of the address space
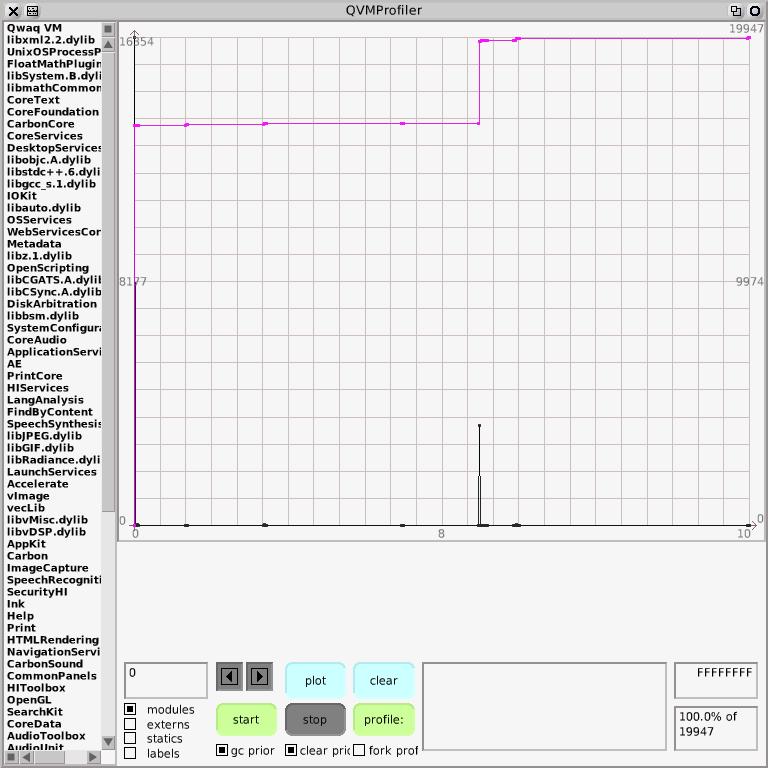
and switch to using the high resolution histogram when zooming in. The spike at the left is the VM but here's that substantial spike in the C library:

Labelling Libraries
Labelling the graph is easy on Mac OS X because the Objective-C runtime is richly introspective and provides convenient access to loaded libraries. One wants to be able to find the currently loaded libraries, because a rich application like Qwaq Forums may load libraries dynamically and so simply listing the libraries the VM is linked against, e.g. via otool -L (otool(1)) or on other unix systems ldd(1), won't provide the full picture. One then needs to extract the symbols from the libraries, and possibly relocate them if the library has been relocated at load time.
On Mac OS X, as declared in /usr/include/mach-o/dyld.h, _dyld_present() answers whether the dynamic linker is in operation, _dyld_image_count answers how many loaded libraries there are, _dyld_get_image_name answers the name of a library given its index, _dyld_get_image_vmaddr_slide answers the relocation, _dyld_get_image_header answers a library's in-memory header and getsectbynamefromheader answers a particular segment in that header. It is a bit of a mouthful but the following plugin answers an Array containing the name, relocation, address and length of the VM and each loaded library. The major complication is that any allocation mght invoke the garbage collector and move things so the Array result needs to be kept on the stack instead of referred to from a local variable.
QVMProfileMacSupportPlugin methods for primitives
primitiveExecutableModulesAndOffsets
"Answer an Array of quads for executable modules (the VM executable
and loaded libraries). Each quad is the module's name, its vm address
relocation in memory, the (unrelocated) start address, and the size."
| present nimages resultObj name valueObj nameObjData slide start size h s |
<export: true>
<var: #name type: 'const char *'>
<var: #nameObjData type: #'char *'>
<var: #h type: 'const struct mach_header *'>
<var: #s type: 'const struct section *'>
<var: #start type: 'unsigned long'>
<var: #size type: 'unsigned long'>
present := self cCode: '_dyld_present()' inSmalltalk: [false].
present ifFalse:
[^interpreterProxy primitiveFail].
nimages := self cCode: '_dyld_image_count()' inSmalltalk: [0].
resultObj := interpreterProxy instantiateClass: interpreterProxy classArray indexableSize: nimages * 4.
resultObj = 0 ifTrue:
[^interpreterProxy primitiveFail].
"Easier keeping the damn thing on the stack than using pushRemappableOop:/popRemappableOop.
Where is topRemappableOop when you need it?"
interpreterProxy push: resultObj.
0 to: nimages - 1 do:
[:i|
start := size := -1. "impossible start & size"
name := self cCode: '_dyld_get_image_name(i)' inSmalltalk: [0].
slide := self cCode: '_dyld_get_image_vmaddr_slide(i)' inSmalltalk: [0].
h := self cCode: '_dyld_get_image_header(i)' inSmalltalk: [0].
h ~= nil ifTrue:
[s := self cCode: 'getsectbynamefromheader(h,SEG_TEXT,SECT_TEXT)' inSmalltalk: [0].
s ~= nil ifTrue:
[start := self cCode: 's->addr' inSmalltalk: [0].
size := self cCode: 's->size' inSmalltalk: [0]]].
valueObj := interpreterProxy
instantiateClass: interpreterProxy classString
indexableSize: (self cCode: 'strlen(name)' inSmalltalk: [name size]).
interpreterProxy failed ifTrue:
[interpreterProxy pop: 1.
^interpreterProxy primitiveFail].
interpreterProxy storePointer: i * 4 ofObject: (interpreterProxy stackValue: 0) withValue: valueObj.
nameObjData := interpreterProxy arrayValueOf: valueObj.
self cCode: 'memcpy(nameObjData, name, strlen(name))' inSmalltalk: [nameObjData].
valueObj := interpreterProxy signed32BitIntegerFor: slide.
interpreterProxy failed ifTrue:
[interpreterProxy pop: 1.
^interpreterProxy primitiveFail].
interpreterProxy storePointer: i * 4 + 1 ofObject: (interpreterProxy stackValue: 0) withValue: valueObj.
valueObj := interpreterProxy positive32BitIntegerFor: start.
interpreterProxy failed ifTrue:
[interpreterProxy pop: 1.
^interpreterProxy primitiveFail].
interpreterProxy storePointer: i * 4 + 2 ofObject: (interpreterProxy stackValue: 0) withValue: valueObj.
valueObj := interpreterProxy positive32BitIntegerFor: size.
interpreterProxy failed ifTrue:
[interpreterProxy pop: 1.
^interpreterProxy primitiveFail].
interpreterProxy storePointer: i * 4 + 3 ofObject: (interpreterProxy stackValue: 0) withValue: valueObj].
resultObj := interpreterProxy stackValue: 0.
^interpreterProxy pop: 2 thenPush: resultObj
This is then accessed through a symbols manager that insulates the graphical tool from the platform-dependent label derivation.
QVMProfilerMacSymbolsManager methods for primitives
primitiveExecutableModulesAndOffsets
"Answer an Array of pairs of executable module names (the VM executable and
all loaded libraries) and the vm address relocation, if any, is for the module."
<primitive: 'primitiveExecutableModulesAndOffsets' module: 'QVMProfileMacSupportPlugin'>
^self primitiveFailed
"self basicNew primitiveExecutableModulesAndOffsets"
Evaluate the comment and you see stuff like
#('/Users/eliot/Cog/stackvm/macbuild/Qwaq VM.app/Contents/MacOS/Qwaq VM' 0 10368 1167456
'/System/Library/Frameworks/CoreFoundation.framework/Versions/A/CoreFoundation' 0 2424351848 690349
'/System/Library/Frameworks/Carbon.framework/Versions/A/Carbon' 0 2461777780 34
...
We can wrap up a module's information conveniently in a class, and have an abstract superclass for any kind of symbol in the executable:
Object subclass: #QVMPSymbol
instanceVariableNames: 'name address limit'
classVariableNames: ''
poolDictionaries: ''
category: 'Qwaq-VMProfiling'
QVMPSymbol subclass: #QVMPExecutableModuleSymbol
instanceVariableNames: 'vmshift shortName'
classVariableNames: ''
poolDictionaries: ''
category: 'Qwaq-VMProfiling'
Listing the labels in a library is easily done via the Unix shell using tools like nm(1). For example
nm -n -f "/Users/eliot/Cog/stackvm/macbuild/Qwaq VM.app/Contents/MacOS/Qwaq VM" | grep -v " [aAU] " >"Qwaq VM"'
lists the symbols in the VM in numeric order (-n) as a single module (-f for flat) instead of individual objects, removes the absolute and undeclared symbols and saves the result in the file Qwaq VM, which looks like
00002880 T start
000028aa t __start
0000298c t dyld_stub_binding_helper
00002998 t __dyld_func_lookup
0000299e T _convertPSTRToString
00002a24 T _convertPassword
00002bd2 T _sqInternetGetMacintoshFileTypeAndCreatorFromkeySizeinto
00002cb2 T _sqInternetConfigurationGetStringKeyedBykeySizeinto
0000328c T _sqInternetConfigurationShutdown
000032c0 T _sqInternetConfigurationInit
...
Again it is a bit of a mouthful but the Squeak code to do this and parse the output into symbols, using the OSProcess interface, is
QVMProfilerMacSymbolsManager methods for parsing
parseSymbolsFor: module
| proc symtab symStream space lf shift prev address |
(tempDir fileExists: module shortName) ifFalse:
[proc := OSProcess thisOSProcess command:
'cd ', tempDir fullName,
';nm -n -f "', module name, '" | grep -v " [aAU] " >"', module shortName, '"'].
symStream := (Array new: 1000) writeStream.
symStream nextPut: module.
space := Character space.
lf := Character lf.
shift := module vmshift.
proc ifNotNil:
[[proc isComplete] whileFalse: [(Delay forMilliseconds: 25) wait]].
symtab := StandardFileStream readOnlyFileNamed: (tempDir fullNameFor: module shortName).
[[symtab atEnd] whileFalse:
[| line ch |
line := (symtab upTo: lf) readStream.
line skipSeparators.
((ch := line peek) notNil and: [ch ~= space]) ifTrue:
[| symbol |
address := self hexFromStream: line.
shift ~= 0 ifTrue: "avoid large integer arith if poss"
[address := maxAddressMask bitAnd: address + shift].
prev notNil ifTrue:
[prev limit: address].
('Tt' includes: line peek)
ifTrue:
[| public |
public := line next == $T.
line skipTo: space.
symbol := (line peek == $L
ifTrue: [QVMPLabelSymbol]
ifFalse:
[public
ifTrue: [QVMPPublicFunctionSymbol]
ifFalse: [QVMPPrivateFunctionSymbol]]) new.
symbol
address: address;
name: line upToEnd.
symStream nextPut: symbol.
symbol type ~~ #label ifTrue:
[prev := symbol]]
ifFalse: "first non-text symbol marks the end of the text segment"
[symtab setToEnd]]].
symbolsByModule at: module put: symStream contents.
prev ifNotNil:
[prev limit: module limit]]
ensure: [symtab close]
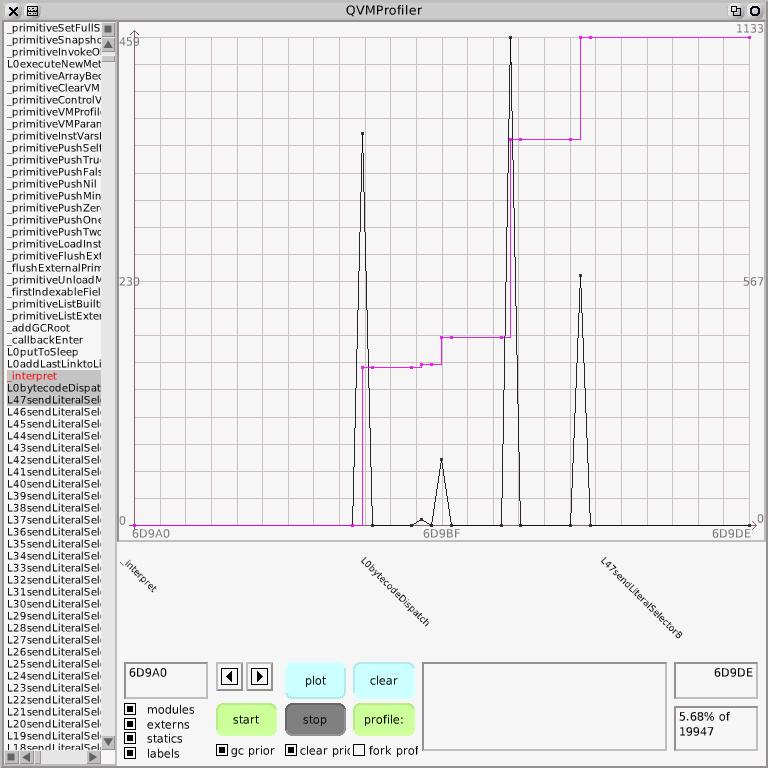
This is one of those infinitely perfectible pieces of code I was alluding to earlier. There is hackery I'm hiding from you here. Parsing all those symbol files takes some ten seconds with the current VM on my mac and it is tedious to wait for the profiler to parse before opening. So all the parsing is done in background processes. The profiler opens immediately displaying only the list of modules. By the time one has recovered one's composure after beholding the wonder of the profiler the symbols have been parsed. With the symbols parsed into QVMSymbol objects we can create a list of symbols in address order, a dictionary of symbol name to symbol and produce the list of symbols to the left of the graph.

The black line is the graph of the samples where the height indicates the number of samples per bin, where a bin is some range of pcs that depend on the current scale of the graph. Zoom in and the pc range per bin gets smaller until one can see individual pcs corresponding to individual instructions. The pink line is the integral of the histogram over the currently displayed range of pcs, so it always starts at bottom-left and, if there are any samples, ends at top-right for 100% of the samples in the current range. In the bottom right-hand corner you can see the proportion of the total samples this range represents, 81.98% of the total number of 19947 samples. On the right of the graph is the integral's range and 16352 / 19947 is indeed about 0.8197724 or there abouts. On the left is the histogram's range, so the highest spike contains 2991 pc samples. Let's zoom in to look at where the integral's gradient and height are highest; that's where the time is going. I can select using the mouse; that's the blue stripe.
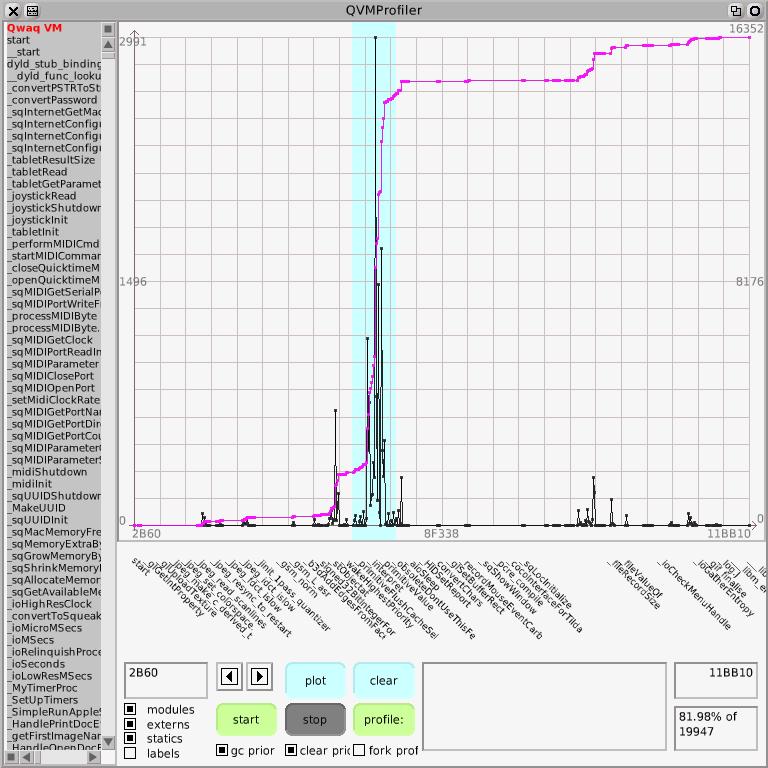
And of course it's the interpreter, whose main function interpret is very large and very costly.

But being able to see that there's a pig in the python (*)
doesn't help much in locating the pig's stomach.
(*) this is from Antoine de Saint-Exupery's The Little Prince:
But they answered : ``Frighten ?  Why should any one be
frightened by a hat ? ''
  My drawing was not a picture of a hat.  It was a picture of
a boa constrictor digesting an elephant.  But since the grown
-ups were not able to understand it, I made another drawing :
I drew the inside of the boa constrictor, so that the grown-ups
could see it clearly.  They always need to have things ex-
plained.  My Drawing Number Two looked like this:
  The grown-ups' response, this time, was to advise me to
lay aside my drawings of boa constrictors, whether from the
inside or the outside, and devote myself instead to geography,
history, arithmetic and grammar.  That is why, at the age of
six, I gave up what might have been a magnificent career as
a painter.  I had been disheartened by the failure of my
Drawing Number One and my Drawing Number Two.
Grown-ups never understand anything by themselves, and
it is tiresome for children to be always and forever explaining
things to them.
What we need is more detail within the _interpret function so that we can distinguish activities like bytecode dispatch and particular bytecodes. We can add labels that will show up in the executable using asm statements. We'll modify the Slang translator, whose job it is to translate the Smalltalk simulation of the virtual machine into the C which is cmpiled to produce the actual VM, to insert macros at relevant points, for example particular bytecodes:
    currentBytecode = byteAtPointer(++localIP);
    while (1) {
        VM_LABEL(0bytecodeDispatch);
        switch (currentBytecode) {
        case 0:
            /* pushReceiverVariableBytecode */
            {

                VM_LABEL(0pushReceiverVariableBytecode);
                                /* begin fetchNextBytecode */
                currentBytecode = byteAtPointer(++localIP);
                /* begin pushReceiverVariable: */
                /* begin internalPush: */
                longAtPointerput(localSP -= BytesPerWord, longAt(((longAt(localFP + FoxReceiver)) + BaseHeaderSize) + ((0 & 15) << ShiftForWord)));
            }
;
            break;
        case 1:
            /* pushReceiverVariableBytecode */
            {

                VM_LABEL(1pushReceiverVariableBytecode);
                                /* begin fetchNextBytecode */
                currentBytecode = byteAtPointer(++localIP);
                /* begin pushReceiverVariable: */
We can then cause the macros to expand into labels in the assembler that the C compler generates:
#ifdef __GNUC__
# define VM_LABEL(foo) asm("\n.globl L" #foo "\nL" #foo ":")
#endif

#if !defined(VM_LABEL)
# define VM_LABEL(foo) 0
#endif
and produce
.globl L0bytecodeDispatch
L0bytecodeDispatch:
# End ASM
                                # LOE ebx ebp edi
L_B270.6:                       # Preds L_B270.5
        cmpl      $255, %edi                                    #1562.3
        ja        L_B270.5      # Prob 82%                      #1562.3
                                # LOE ebx ebp edi
L_B270.7:                       # Preds L_B270.6                # Infreq
        movl      L..1..TPKT.4_0.0.318(,%edi,4), %edx           #1562.3
        lea       L._1._interpret.TAG.IGBASE.0.318, %eax        #1562.3
        addl      %eax, %edx                                    #1562.3
        jmp       *%edx                                         #1562.3
Now we can identify distinct activities:

Here for example is bytecode dispatch:
So I can tell that the bounds check that over the last thirty years I've found that C compilers always fail to spot is unnecessary, because all 256 cases in the switch (currentBytecode) case statement are present
        cmpl      $255, %edi                                    #1562.3
        ja        L_B270.5      # Prob 82%                      #1562.3
costs nearly two percent of entire execution time, and that the 5.8% of execution time in bytecode dispatch is of the same order as the 7% in message lookup. And of course generating a report form the data makes sense:
	/Users/eliot/Qwaq/QFCI1.2.28.app/Contents/MacOS/Qwaq VM eem 12/30/2008 18:23

	gc prior.  clear prior.
	13.898 seconds; sampling frequency 1435 hz
	11127 samples in the Interpreter	(19947 samples in the entire program)  55.78% of total

	% of interpret (% of total)									(samples) (cumulative)
	10.34%    (  5.77%)	L0internalActivateNewMethod				(1151)	(10.34%)
	10.18%    (  5.68%)	L0bytecodeDispatch						(1133)	(20.53%)
	  7.69%    (  4.29%)	L0lookupInMethodCacheSelclass				(856)		(28.22%)
	  5.44%    (  3.03%)	L0normalSend							(605)		(33.66%)
	  4.05%    (  2.26%)	L0internalStoreContextRegisters				(451)		(37.71%)
	  3.57%    (  1.99%)	L0internalExecuteNewMethod				(397)		(41.28%)
	  3.28%    (  1.83%)	L0commonReturn						(365)		(44.56%)
	  2.84%    (  1.58%)	L0pushReceiverVariableBytecode				(316)		(47.40%)
	  2.76%    (  1.54%)	L0internalFetchContextRegisters				(307)		(50.16%)
	  2.53%    (  1.41%)	L0pushTemporaryVariableBytecode			(281)		(52.68%)
	  2.20%    (  1.23%)	L0recycleContextIfPossible					(245)		(54.88%)
	  2.02%    (  1.13%)	L0returnTopFromMethod					(225)		(56.91%)
	  1.82%    (  1.02%)	L0internalQuickCheckForInterrupts			(203)		(58.73%)
	  1.80%    (  1.00%)	L1internalFetchContextRegisters				(200)		(60.53%)
Fully 5.8% of entire execution time is in method activation. Now we have a profiler that can drill down let me put this in stark contrast using an activation-return benchmark, nfib, that in Squeak is called benchFib:
Integer methods for benchmarks
benchFib "Handy send-heavy benchmark"
"(result // seconds to run) = approx calls per second"
" | r t |
t := Time millisecondsToRun: [r := 26 benchFib].
(r * 1000) // t"
"138000 on a Mac 8100/100"
^ self < 2
ifTrue: [1]
ifFalse: [(self-1) benchFib + (self-2) benchFib + 1]
Because the recursing arm also adds one the result is the number of sends needed to evaluate it. 10 benchFib is 177 and required 177 sends, creating 177 activations, to compute it. nfib is a great way to roughly compare send/return performance across language implementations. Fnd a value for which the implementation takes a few seconds to evaluate nfib, then divide the result by the time to get activations per second. The vanilla Squeak VM running on my MacBook Pro (2.16GHz Intel Core Duo) does about 8.1 million sends per second. gcc-compiled C (-O1) does about 121 million sends per second, fifteen times faster than the vanilla Squeak VM. Of course that wonderfully fast C code also claims that nfib of 44 is -2025160957 😉
So what does e.g. 39 benchFib look like in the VM?

Here's where nearly a quarter of entire execution time is going, activation:

In the gory detail:
	/Users/eliot/Qwaq/QFCI1.2.28.app/Contents/MacOS/Qwaq VM eem 12/30/2008 18:31

	39 benchFib

	gc prior.  clear prior.
	25.496 seconds; sampling frequency 1465 hz
	37317 samples in the Interpreter	(37347 samples in the entire program)  99.92% of total

	% of interpret (% of total)								(samples) (cumulative)
	13.46%    (13.45%)	L0internalActivateNewMethod			(5023)	(13.46%)
	12.90%    (12.89%)	L0bytecodeDispatch					(4815)	(26.36%)
	  6.40%    (  6.39%)	L0internalStoreContextRegisters			(2387)	(32.76%)
	  5.99%    (  5.99%)	L0commonReturn					(2237)	(38.75%)
	  5.54%    (  5.53%)	L0lookupInMethodCacheSelclass			(2067)	(44.29%)
	  5.53%    (  5.53%)	L0bytecodePrimAdd					(2065)	(49.83%)
	  5.38%    (  5.37%)	L0normalSend						(2007)	(55.21%)
	  4.95%    (  4.95%)	L0bytecodePrimSubtract				(1847)	(60.15%)
	  4.62%    (  4.61%)	L0pushReceiverBytecode				(1723)	(64.77%)
	  4.21%    (  4.20%)	L0internalFetchContextRegisters			(1570)	(68.98%)
	  3.94%    (  3.94%)	L0pushConstantOneBytecode			(1471)	(72.92%)
	  3.93%    (  3.92%)	L0recycleContextIfPossible				(1465)	(76.85%)
	  3.08%    (  3.08%)	L1internalFetchContextRegisters			(1151)	(79.93%)
	  2.86%    (  2.86%)	L0internalQuickCheckForInterrupts		(1068)	(82.79%)
	  2.81%    (  2.81%)	L0pushConstantTwoBytecode			(1049)	(85.60%)
	  2.63%    (  2.63%)	L0sendLiteralSelectorBytecode			(981)		(88.23%)
	  2.33%    (  2.33%)	L0returnTopFromMethod				(869)		(90.56%)
	  2.22%    (  2.21%)	L0internalExecuteNewMethod			(827)		(92.78%)
	  2.07%    (  2.07%)	L0booleanCheat						(774)		(94.85%)
	  1.68%    (  1.68%)	L0pushReceiverVariableBytecode			(626)		(96.53%)
	  1.46%    (  1.46%)	L0longUnconditionalJump				(546)		(97.99%)
	  1.17%    (  1.17%)	L0bytecodePrimLessThan				(436)		(99.16%)
	  0.84%    (  0.84%)	L0storePointerofObjectwithValue			(312)		(100.0%)
	  0.00%    (  0.00%)	...others...							(1)		(100.0%)
we can charge all of
	L0internalActivateNewMethod
	L0internalStoreContextRegisters
	L0commonReturn
	L0internalFetchContextRegisters
to activation/return for a grand total of 30.03% of entire execution time.
The cost here is contexts. For every send a new context must be allocated, and, adding insult to injury, the receiver and arguments must be copied from the caller context to the callee context, something that a stack organization eliminates. But that's for the next post. Happy new year!